
- ProbabilityGrid用于表示概率图,它是Grid2D派生类,由它构造的对象存放在ActiveSubmaps2D成员变量submaps_。
- 刚创建的概率图有个固定尺寸,100(kInitialSubmapSize)x100,换到真实世界是2.5mx2.5m。随着点云不断到来,新点云有些点落在了概率图之外,这时得扩大概率图。扩大时num_x_cells、num_y_cells各增大一倍,新图面积是旧图4倍。新、旧图中心对齐。
- 目前测试下来,cell_limits_.num_x_cells总是等于cell_limits_.num_y_cells,即概论图总是正方形。
- 将点云画到概率图,实质是根据点云值更新相关栅格的概率值。过程中,点云会逆时针旋转90度。
- 概率栅格图中,栅格初始值是kUnknownCorrespondenceValue(0)。
LocalTrajectoryBuilder2D::AddRangeData算出local-pose,由它得到local-pose坐标系下的点云(sensor::RangeData)后,就要把点云画到概率图。
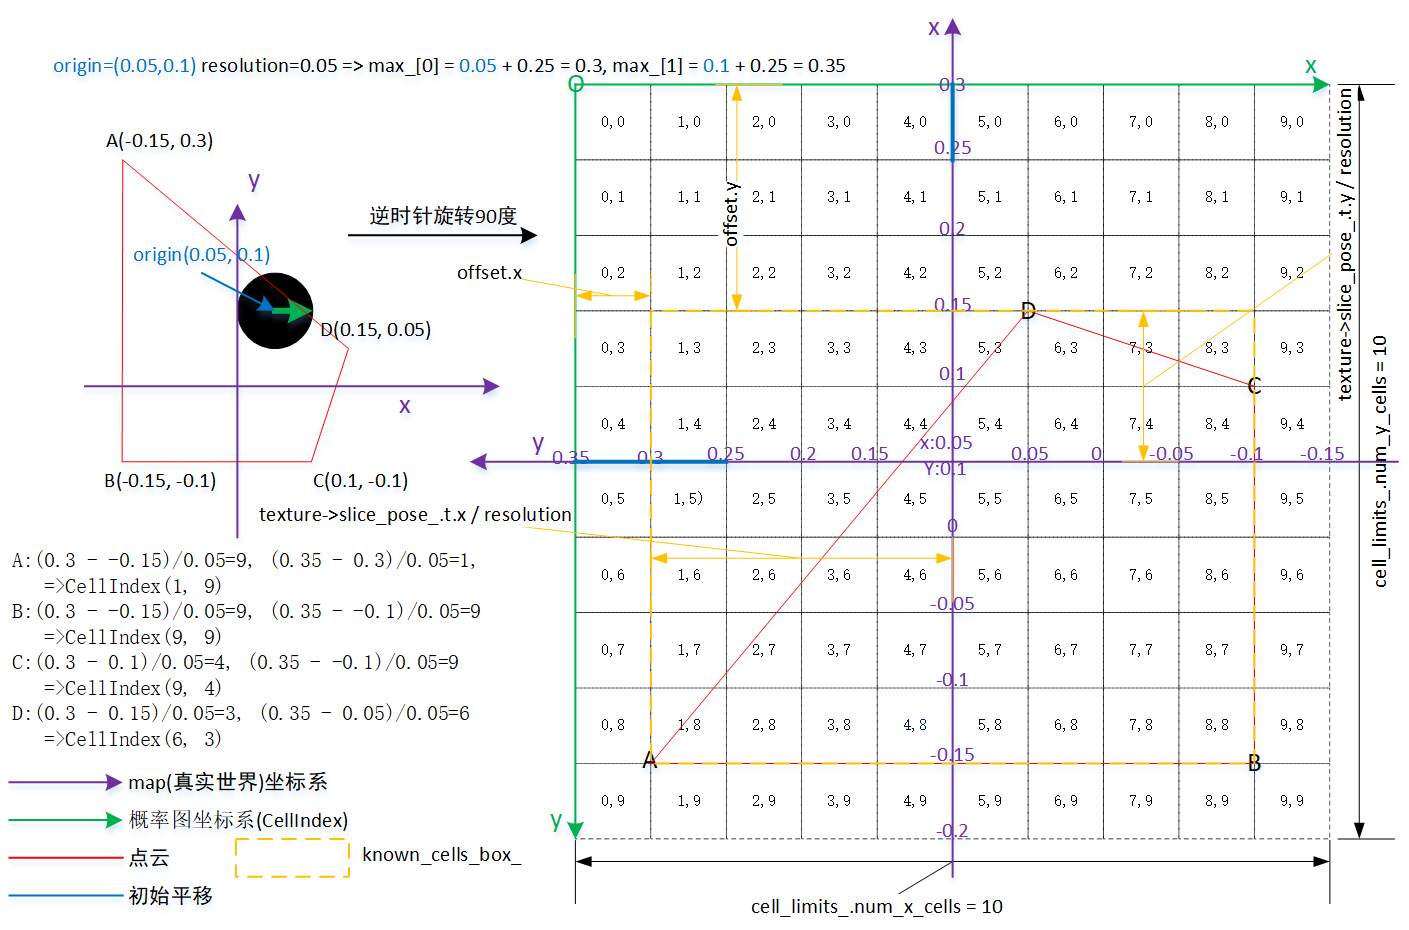
图1显示了一帧点云如何画到概率图。左侧是点云,右侧是画到概率图后的结果。绿色坐标系是概率图的坐标系,原点在左上角,水平方向,x坐标值从左到右变大;垂直方向,y坐标值从上到下变大。
概率图中,两相邻坐标间的单元称为栅格(Cell),是正方形,其坐标叫CellIndex。一个栅格表示resolution*resolution的真实世界面积。举个例子,resolution=0.05时,一个栅格面积就是5cm*5cm。
栅格中存的值是概率,概率有两种:占用和空闲。为方便ScanMatch转换成最小二乘问题,概率图中栅格存储着以uint16_t表示的空闲概率:CorrespondenceCostValue。
一旦创建了概率图,那它就固定了一个有效范围,有效范围的面积是cell_limits_.num_x_cells(每行cell个数) * num_y_cells(每列cell个数)。在图1,只显示了概率图中有效范围。通过MapLimits::GetCellIndex(point),可从点云坐标换算到CellIndex,此操作可能算出不在有效范围的CellIndex。而一个CellIndex是不是有效,可用MapLimits::Contains(cell_index)进行判断。
图1中,laser(激光雷达)有个初始平移:(0.05m, 0.1m),即laser坐标系原点在map坐标系的坐标是(0.05, 0.1)。这个初始平移不会影响概率图尺寸,但会影响概率图在map坐标系的位置。如果平移是(0, 0),此个概率图的位置是左上角(-0.25m, 0.25m)、尺寸5cmx5cm的矩形。平移变成(0.05m, 0.1m)后,概率图的位置变成了左上角(-0.2m, 0.35m)、尺寸5cmx5cm的矩形。当然,这个变动是针对map坐标系,对laser坐标系来说,不论初始平移是何值,它的左上角坐标总是(-0.25m, 0.25m)。这符合物理意义:雷达在map坐标系移动,它能扫描的范围总是以laser原点为中心的一个固定尺寸矩形,只是随着不断移动,这个矩形在map坐标系的位置会改变。
ProbabilityGrid用于表示概率图,它是Grid2D派生类,由它构造的对象存放在ActiveSubmaps2D成员变量submaps_。
class Grid2D : public GridInterface {
  // 概率图范围
  MapLimits limits_;
  // 概率图中每个栅格的概率值。一旦初始化了概率图后,correspondence_cost_cells_.size()尺寸就定了,
  // cell_limits_.num_x_cells * cell_limits_.num_y_cells,每个cell赋给了初值kUnknownCorrespondenceValue。
  std::vector<uint16> correspondence_cost_cells_;
  // 地图概率最小值
  float min_correspondence_cost_;
  // 地图概率最大值
  float max_correspondence_cost_;
  // 记录被更新的栅格索引
  std::vector<int> update_indices_;

  // Bounding box of known cells to efficiently compute cropping limits.
  // 已知概率的cells的盒子,方便做裁剪
  Eigen::AlignedBox2i known_cells_box_;
  const std::vector<float>* value_to_correspondence_cost_table_;
};
一、MapLimits
MapLimits用于描述概率图的范围。
struct CellLimits {
  // x轴上的栅格数量
  int num_x_cells = 0;
  // y轴上的栅格数量
  int num_y_cells = 0;
};

class MapLimits {
  // 地图的分辨率,即一个栅格对应的地图尺寸。
  double resolution_;
  // 记录了地图的x和y方向上的最大值。
  Eigen::Vector2d max_;
  // x和y方向上的栅格数量
  CellLimits cell_limits_;
};
cell_limits_值是两个方向上栅格数,用于表示概率图尺寸。那max_是什么,它和cell_limits_是什么关系?
max_是CellIndex坐标系原点在map坐标系下的坐标,不论x、y,其坐标值都是该概率图在map坐标系的最大值(这或许就是为什么这变量叫max_),要直观看的话,就是图1所示的左上角。max_值属于map坐标系,所以属于map坐标系下的坐标可以它和直接加、减。因为x/y都是最大值,那减法就表示了某个map坐标距离CellIndex坐标系原点距离,这距离除以0.05(resolution),就是该map坐标对应的CellIndex坐标。
max_是个Vector2d,[0]用于x方向,[1]用于y方向。它的值由两部分构成:原点偏移 + resolution * cell_indexs_ / 2。原点偏移指的该点云在map坐标系下的偏移,即sensor::RangeData.origin。让看个实例。
origin: [1.15601, 0.387012];
cell_limits_.num_x_cells = 100;
cell_limits_.num_y_cells = 100;
resolution:0.05;
==>
max_[0]=1.15601 + 0.5 * 100 * 0.05 = 3.65601;
max_[1]=0.387012 + 0.5 * 100 * 0.05 = 2.88701;
max_单位是米,借由它,MapLimits可从点云坐标快速算出CellIndex。随着点云不断到来,新点云有些点落在了概率图之外,这时得扩大概率图(后面Grid2D::GrowLimits会描述扩大)。扩大概率图时,num_x_cells、num_y_cells各增大一倍,而origin是不变的,以下是第一次扩大后的max_。
origin: [1.15601, 0.387012];
cell_limits_.num_x_cells = 200;
cell_limits_.num_y_cells = 200;
resolution:0.05;
==>
max_[0]=1.15601 + 0.5 * 200 * 0.05 = 6.15601;
max_[1]=0.387012 + 0.5 * 200 * 0.05 = 5.38701;
也就是说,第一次扩大概率图后,num_x_cells、num_y_cells会是原值两倍,但如果存在不为0的origin,那max_就不是了。
目前测试下来,cell_limits_.num_x_cells总是等于cell_limits_.num_y_cells。
让看下MapLimits两个常用操作:GetCellIndex、Contains。
1.1 GetCellIndex
GetCellIndex用于把某个点的2D坐标换算出它在概率图中的坐标CellIndex。返回值可能是负数或很大的值,并且出了概率图的有效范围,这时以它为参数执行Contains()会返回false。
Eigen::Array2i MapLimits::GetCellIndex(const Eigen::Vector2f& point) const {
  // Index values are row major and the top left has Eigen::Array2i::Zero()
  // and contains (centered_max_x, centered_max_y). We need to flip and
  // rotate.
  // 这里要注意Array2i的[0],即CellIndex.x是由来自点云坐标的y,相应地CellIndex.y来自点云坐标x。
  // 通过图1,会发现画点云时逆时针旋转了90度。
  return Eigen::Array2i(
      common::RoundToInt((max_.y() - point.y()) / resolution_ - 0.5),
      common::RoundToInt((max_.x() - point.x()) / resolution_ - 0.5));
}
通过图1的A、B、C、D可验证这个转换。当然,现实中不大可能存在范围不超过5cmx5cm点云,让看个现实示例,max_=(2.5m, 2.5m), point是(-1.42362m, -4.96862m),此时得到的CellIndex是(149, 78),它已出了概率图有效范围。
CellIndex[0]=(-4.96862 - 2.5) / 0.05 - 0.5 = 149
CellIndex[1]=(-1.42362 - 2.5) / 0.05 - 0.5 = 78
1.2 Contains
// 判断cell_index是否在概率图中,即落在有效范围,是的返回true,否则false。
bool MapLimits::Contains(const Eigen::Array2i& cell_index) const {
  return (Eigen::Array2i(0, 0) <= cell_index).all() &&
         (cell_index <
          Eigen::Array2i(cell_limits_.num_x_cells, cell_limits_.num_y_cells))
             .all();
}
对判断条件换个描述:(0, 0) <= CellIndex < (cell_limits_.num_x_cells, cell_limits_.num_y_cells)。从GetCellIndex可得出,cell_index[0]是y方向,但这里比较时用了cell_limits_.num_x_cells,这是bug吗?——不过实测下来,cell_limits_.num_x_cells总是等于cell_limits_.num_y_cells,若有这个前提,即使是bug不会影响结果。
二、扩大概率图
std::unique_ptr<GridInterface> ActiveSubmaps2D::CreateGrid(
    const Eigen::Vector2f& origin) {
  constexpr int kInitialSubmapSize = 100;
  float resolution = options_.grid_options_2d().resolution();
  switch (options_.grid_options_2d().grid_type()) {
    case proto::GridOptions2D::PROBABILITY_GRID:
      return absl::make_unique<ProbabilityGrid>(
          MapLimits(resolution,
                    origin.cast<double>() + 0.5 * kInitialSubmapSize *
                                                resolution *
                                                Eigen::Vector2d::Ones(),
                    CellLimits(kInitialSubmapSize, kInitialSubmapSize)),
          &conversion_tables_);
   ...
   }
}
ActiveSubmaps2D::CreateGrid执行创建概率图,刚创建的概率图有个固定尺寸,100(kInitialSubmapSize)x100,换到真实世界是2.5mx2.5m。随着点云不断到来,新点云有些点落在了概率图之外,这时得扩大概率图,Grid2D::GrowLimits执行这个扩大。
- point。基于点云会生成个Eigen::AlignedBox,它往往是这个AlignedBox的左上角、右下角。只要这两处坐标落在概率图内,可以肯定所有点云落在这概率图内了。
- 虽然grids、grids_unknown_cell_values类型是std::vector,但要没意外,size都是1。grids_unknown_cell_values[0]的值就是kUnknownCorrespondenceValue,即[0, 32767]中的0。
void Grid2D::GrowLimits(const Eigen::Vector2f& point,
                        const std::vector<std::vector*>& grids,
                        const std::vector& grids_unknown_cell_values) {
  CHECK(update_indices_.empty());
  while (!limits_.Contains(limits_.GetCellIndex(point))) {
    // 如果在原来的地图网格内,则不扩展,否则扩“2倍”大小
    const int x_offset = limits_.cell_limits().num_x_cells / 2;
    const int y_offset = limits_.cell_limits().num_y_cells / 2;

    // limits_.max()包含了构建该Grid2D时第一帧的平移。这个平移是由第一帧点云决定。
    const MapLimits new_limits(
        limits_.resolution(),
        limits_.max() +
            limits_.resolution() * Eigen::Vector2d(y_offset, x_offset),
        CellLimits(2 * limits_.cell_limits().num_x_cells,
                   2 * limits_.cell_limits().num_y_cells));
    const int stride = new_limits.cell_limits().num_x_cells;
    const int offset = x_offset + stride * y_offset;
    const int new_size = new_limits.cell_limits().num_x_cells *
                         new_limits.cell_limits().num_y_cells;

    for (size_t grid_index = 0; grid_index < grids.size(); ++grid_index) {
      // 新概率图中所有cell具有初值kUnknownCorrespondenceValue。
      std::vector new_cells(new_size,
                                    grids_unknown_cell_values[grid_index]);
      // 取旧图中的那些cell值赋值,赋值到对应新图中的cell。
      for (int i = 0; i < limits_.cell_limits().num_y_cells; ++i) {
        for (int j = 0; j < limits_.cell_limits().num_x_cells; ++j) {
          new_cells[offset + j + i * stride] =
              (*grids[grid_index])[j + i * limits_.cell_limits().num_x_cells];
        }
      }
      // 替换correspondence_cost_cells_。
      *grids[grid_index] = new_cells;
    }
    // 替换limits_。
    limits_ = new_limits;
    if (!known_cells_box_.isEmpty()) {
      known_cells_box_.translate(Eigen::Vector2i(x_offset, y_offset));
    }
  }
}
GrowLimits有着以下逻辑。
- 判断point是否在当前概率图中,在就退出,否则进入步骤2。
- 扩大概率图时,num_x_cells、num_y_cells各增大一倍,扩大后的新图面积是旧图4倍。新、旧图中心对齐。
- 给新图中所有栅格赋值。1)旧图中有的栅格,取旧图中的值。2)旧图中没有的栅格,赋初值kUnknownCorrespondenceValue。
- known_cells_box_这个边界(AlignedBox),向右平移旧图的num_x_cells / 2,向下平移旧图的num_y_cells / 2。
三、点云画到概率图
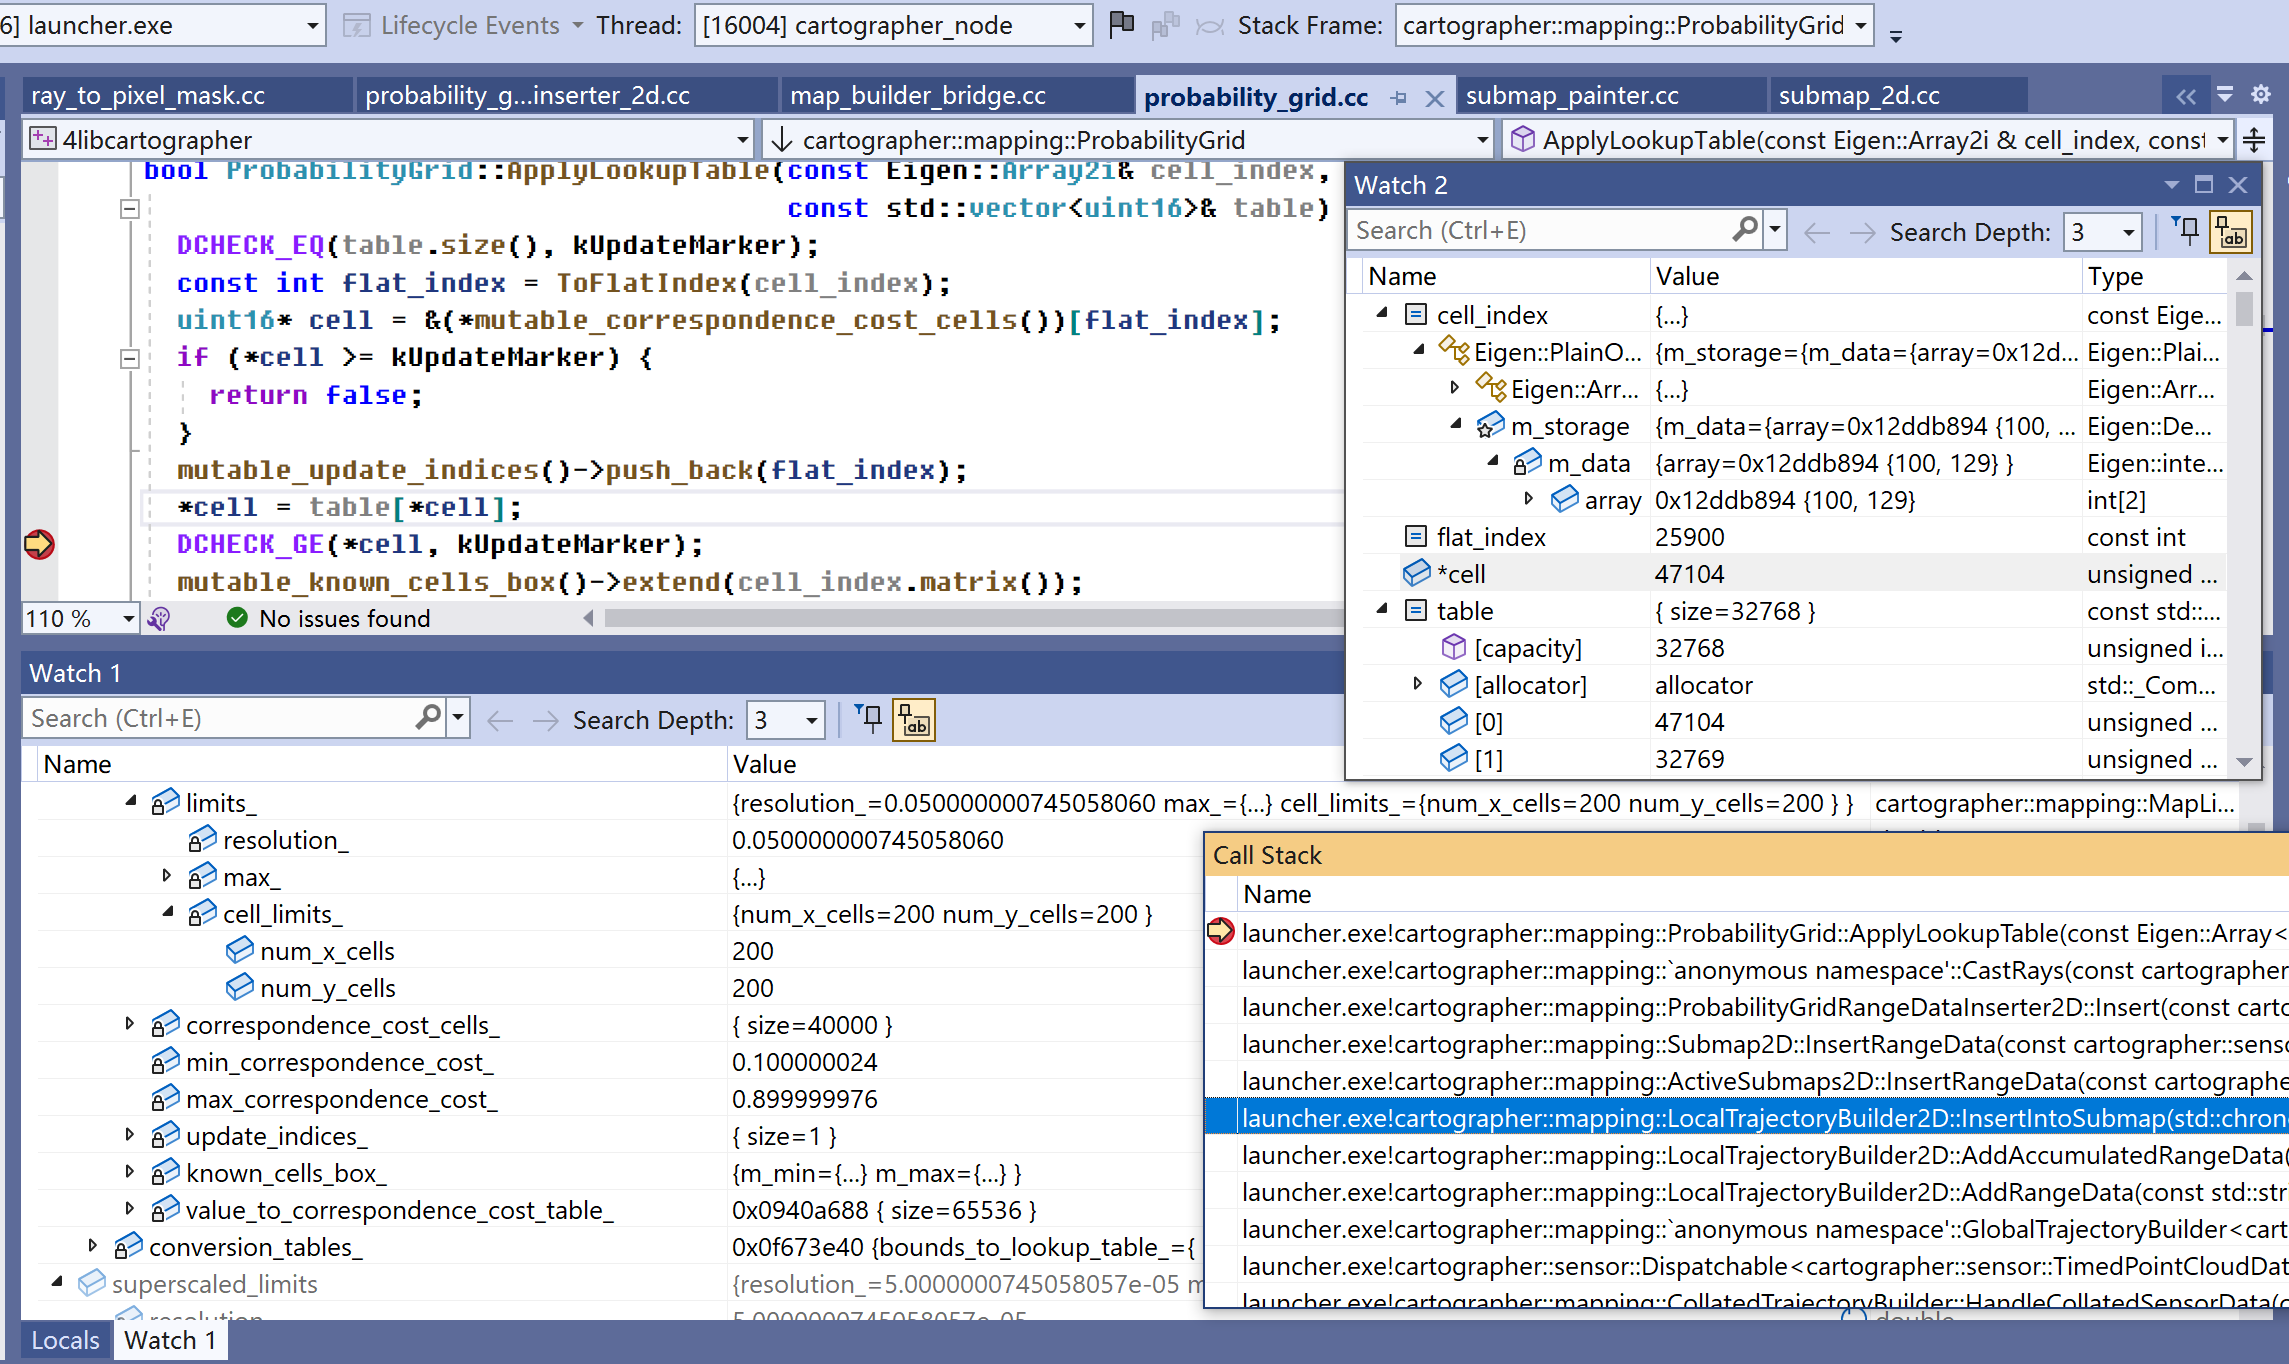
ApplyLookupTable负责更新某个cell的CorrespondenceCostValue。从图2中的“Call Stack”看它的调用时机。
- 在LocalTrajectoryBuilder2D,算出local_pose后,由它算出此次在odom坐标系下点云range_data_in_local,以它为参数调用ActiveSubmaps2D::InsertRangeData。
- 在ActiveSubmaps2D,调用Submap2D::InsertRangeData把点云画向最近两个子图。
- 在Submap2D,调用ProbabilityGridRangeDataInserter2D::Insert把点云画向概率栅格图。
- 在ProbabilityGridRangeDataInserter2D::Insert,调用CastRays执行更新操作。CastRays不是哪个类的成员函数,但调用它须提供一个ProbabilityGrid类型的参数。
- 在CastRays,要更新不少栅格。更新某个栅格时,不论hit还是miss,统一调用ApplyLookupTable,它是类ProbabilityGrid的成员函数,对象指针来自调用CastRays时提供的参数。
针对图2示例,该栅格之前值(*cell)是0(kUnknownCorrespondenceValue),此次观测到hit。于是要查的表table指向hit_table_,查这个表,旧值0作为索引,查找得新值应该是47104,于是更新后栅格值是47104,即变量*cell是47104。
对某个栅格来说,CorrespondenceCostValue(整数表示的空闲概率)表示栅格状态。经过ApplyLookupTable更新后,该值肯定或在hit_table_,或在miss_table_,是个>=kUpdateMarker(32768)的值。但向上返回到ProbabilityGridRangeDataInserter2D::Insert,后者在执行完CastRays后,会调用probability_grid->FinishUpdate(),它会把栅格值减去kUpdateMarker。所以只要在ProbabilityGridRangeDataInserter2D::Insert后,栅格值范围就限制在了[0, kUpdateMarker-1]。
接下让从ProbabilityGridRangeDataInserter2D::Insert开始,一直到ProbabilityGrid::ApplyLookupTable。
3.1 ProbabilityGridRangeDataInserter2D::Insert
void ProbabilityGridRangeDataInserter2D::Insert(
    const sensor::RangeData& range_data, GridInterface* const grid) const {
  ProbabilityGrid* const probability_grid = static_cast<ProbabilityGrid*>(grid);
  CHECK(probability_grid != nullptr);
  // By not finishing the update after hits are inserted, we give hits priority
  // (i.e. no hits will be ignored because of a miss in the same cell).
  CastRays(range_data, hit_table_, miss_table_, options_.insert_free_space(),
           probability_grid);
  probability_grid->FinishUpdate();
}

void Grid2D::FinishUpdate() {
  while (!update_indices_.empty()) {
    DCHECK_GE(correspondence_cost_cells_[update_indices_.back()],
              kUpdateMarker);
    correspondence_cost_cells_[update_indices_.back()] -= kUpdateMarker;
    update_indices_.pop_back();
  }
}
ProbabilityGridRangeDataInserter2D::Insert依次执行两个操作。
- 调用CastRays将点云“画”到概率图,画的过程是根据点云值更新相关栅格的概率值。
- update_indices_是更新此帧点云时涉及到的栅格集合。栅格一旦更新过,其概率值一定>=kUpdateMarker,FinishUpdate调整这些值。
3.2 CastRay
CastRay把RangeData要处理的点分为两类,第一类是终点在概率图内、归属于returns集合的点;第二类是终点在概率图外,归属到misses集合的点。
- 终点在概率图内、属于returns集合的点
。计算出一条从原点到
的射线,射线端点处的点是Hit,射线中间的点是Free。
- 终点应该落在概率图外,属于misses集合的点。对这些点,存在栅格的终点在原点到
画的过程就是更新这些点涉及到的栅格的概率值。
void CastRays(const sensor::RangeData& range_data,
              const std::vector<uint16>& hit_table,
              const std::vector<uint16>& miss_table,
              const bool insert_free_space, ProbabilityGrid* probability_grid) {
  GrowAsNeeded(range_data, probability_grid);

  // 获取栅格地图的limits
  const MapLimits& limits = probability_grid->limits();
  // 定义一个超分辨率,把当前的分辨率又划分成了kSubpixelScale份,这里int kSubpixelScale = 1000
  const double superscaled_resolution = limits.resolution() / kSubpixelScale;
  // 根据超分辨率又生成了一个新的MapLimits
  const MapLimits superscaled_limits(
      superscaled_resolution, limits.max(),
      CellLimits(limits.cell_limits().num_x_cells * kSubpixelScale,
                 limits.cell_limits().num_y_cells * kSubpixelScale));
  // 根据RangeData原点的前两项,获取其对应的CellIndex。该坐标是我们所求的射线的原点。
  const Eigen::Array2i begin =
      superscaled_limits.GetCellIndex(range_data.origin.head<2>());
  // Compute and add the end points.
  // 定义一个向量集合,该集合存储RangeData中的hits的点。
  std::vector<Eigen::Array2i> ends;
  ends.reserve(range_data.returns.size());
  for (const sensor::RangefinderPoint& hit : range_data.returns) {
    // 遍历returns这个集合,把每个点先压入ends中,
    ends.push_back(superscaled_limits.GetCellIndex(hit.position.head<2>()));
    // ends.back()返回的是vector中的最末尾项,也就是我们刚刚压入vector中的那一项;
    // hit_table就是预先计算好的hit查找表。如果一个cell,原先的值是value,那么在检测到hit后应该更新为多少
    probability_grid->ApplyLookupTable(ends.back() / kSubpixelScale, hit_table);
  }

  if (!insert_free_space) {
    // 如果配置项里设置是不考虑free space。那么函数到这里结束,只处理完hit后返回即可
    // 否则的话,需要计算那条射线,射线中间的点都是free space,同时,没有检测到hit的misses集里也都是free
    // 默认insert_free_space=true,即不进这个入口。
    return;
  }

  // Now add the misses.
  // 处理origin跟hit之间的射线中间的点
  for (const Eigen::Array2i& end : ends) {
    std::vector<Eigen::Array2i> ray =
        RayToPixelMask(begin, end, kSubpixelScale);
    for (const Eigen::Array2i& cell_index : ray) {
      probability_grid->ApplyLookupTable(cell_index, miss_table);
    }
  }

  // Finally, compute and add empty rays based on misses in the range data.
  // 同样处理miss集合中的点
  for (const sensor::RangefinderPoint& missing_echo : range_data.misses) {
    std::vector<Eigen::Array2i> ray = RayToPixelMask(
        begin, superscaled_limits.GetCellIndex(missing_echo.position.head<2>()),
        kSubpixelScale);
    for (const Eigen::Array2i& cell_index : ray) {
      probability_grid->ApplyLookupTable(cell_index, miss_table);
    }
  }
}
在CastRays中处理RangeData的数据时,又用到了一个超分辨率像素的概念,即将一个cell又进一步划分成kSubpixelScale * kSubpixelScale个cell,其中,kSubpixelScale = 1000。这样,在计算origin到end之间的射线方程时可以做到更精确。
CastRays调用ApplyLookupTable更新某个cell。对更新有个规则:在一次点云时,某个cell只会更新一次。以下是操作逻辑。“probability_values.h/c:占据概率相关”中“概率更新查找表:hit_table_、miss_table_”有关于概率更新的详细说明。
- [ApplyLookupTable]更新cell-A时会自动得到一个>=kUpdateMarker的值,并把cell-A坐标放入update_indices_集合。
- [ApplyLookupTable]如果此帧点云又判断出要更新cell-A,但发现值已>=kUpdateMarker,认为此轮已更新过,不执行操作。
- [Grid2D::FinishUpdate]更新完了此帧点云,将update_indices_集合中的栅格值减去kUpdateMarker。
3.3 ProbabilityGrid::ApplyLookupTable
@cell_index。它是正常概率图中的CellIndex,不是超分辨率的。
@table。更新查找表。更新有两个原因:hit或miss,对应它们分别有hit_table、miss_table。
bool ProbabilityGrid::ApplyLookupTable(const Eigen::Array2i& cell_index,
                                       const std::vector& table) {
  // 用于更新的表的大小是固定的
  DCHECK_EQ(table.size(), kUpdateMarker);
  const int flat_index = ToFlatIndex(cell_index);
  // 这里就是取得原来的correspondence_cost值是uint16的
  uint16* cell = &(*mutable_correspondence_cost_cells())[flat_index];
  // cell初始值为0(kUnknownCorrespondenceValue),被更新一次之后会大于kUpdateMarker
  // 目的是防止在一次更新过程中多次更新一个点的值
  if (*cell >= kUpdateMarker) {
    return false;
  }
  // 那什么时候<kUpdateMaker?——更新完此帧点云后,见void Grid2D::FinishUpdate()
  // 更新了的index记录下,方便FinishUpdate一次性减去kUpdateMarker。
  mutable_update_indices()->push_back(flat_index);
  // 更新!
  *cell = table[*cell];
  DCHECK_GE(*cell, kUpdateMarker);
  mutable_known_cells_box()->extend(cell_index.matrix());
  return true;
}
四、ProbabilityGrid::DrawToSubmapTexture
“发布地图(map话题)”时,会以子图索引为参数获取概率图,过程中会调用DrawToSubmapTexture,用于把概率图序列化为SubmapTexture对象。
struct SubmapQueryResponse
{
  cartographer_ros_msgs::StatusResponse status;
  int32_t submap_version;
  std::vector< ::cartographer_ros_msgs::SubmapTexture> textures;
};

@texture:要把概率图序列到的SubmapTexture对象。
@local_pose:它是AddRangeData算出的该子图的初始位姿,不是Global SLAM优化出的全局位姿。
bool ProbabilityGrid::DrawToSubmapTexture(
    proto::SubmapQuery::Response::SubmapTexture* const texture,
    transform::Rigid3d local_pose) const {
  Eigen::Array2i offset;
  CellLimits cell_limits;
  // offset意义见图1的offset.x、offset.y。
  // cell_limits意义见图1的known_cells_box_.size() + 1
  ComputeCroppedLimits(&offset, &cell_limits);
  std::string cells;
  for (const Eigen::Array2i& xy_index : XYIndexRangeIterator(cell_limits)) {
    if (!IsKnown(xy_index + offset)) {
      cells.push_back(0 /* unknown log odds value */);
      cells.push_back(0 /* alpha */);
      continue;
    }
    // We would like to add 'delta' but this is not possible using a value and
    // alpha. We use premultiplied alpha, so when 'delta' is positive we can
    // add it by setting 'alpha' to zero. If it is negative, we set 'value' to
    // zero, and use 'alpha' to subtract. This is only correct when the pixel
    // is currently white, so walls will look too gray. This should be hard to
    // detect visually for the user, though.
    const int delta =
        128 - ProbabilityToLogOddsInteger(GetProbability(xy_index + offset));
    const uint8 alpha = delta > 0 ? 0 : -delta;
    const uint8 value = delta > 0 ? delta : 0;
    cells.push_back(value);
    cells.push_back((value || alpha) ? alpha : 1);
  }
  common::FastGzipString(cells, texture->mutable_cells());
  texture->set_width(cell_limits.num_x_cells);
  texture->set_height(cell_limits.num_y_cells);
  const double resolution = limits().resolution();
  texture->set_resolution(resolution);
  const double max_x = limits().max().x() - resolution * offset.y();
  const double max_y = limits().max().y() - resolution * offset.x();
  // slice_pose_指经过local_pose修正后,以known_cells_box_左上角为(0, 0),laser坐标系原点在known_cells_box_内的偏移。
  *texture->mutable_slice_pose() = transform::ToProto(
      local_pose.inverse() *
      transform::Rigid3d::Translation(Eigen::Vector3d(max_x, max_y, 0.)));
  return true;
}
limits().max()由两部构成:原点偏移 + resolution * cell_indexs_ / 2,经过transform::ToProto(...)中乘法,去除了原点偏移部分。成了以下公式。
texture->slice_pose_ = resolution * cell_limits_ / 2 - resolution * offset
见图1中texture->slice_pose_.t,slice_pose_指经过local_pose修正后,以known_cells_box_左上角为(0, 0),laser坐标系原点在known_cells_box_内的偏移。
五、Eigen::AlignedBox
概率图了Eigen提供的一个类型:Eigen::AlignedBox<scalar, scalar>。这个类代表由边界构成的区域,第一个scalar代表边界的数据类型(例如int, float, double等),第二个scalar代表边界的维度(通常为1, 2, 3)
网上有相关资料,这里简单列下相关api。以下假设第一个scalar是float。
- min(): 返回边界中最小的角点。左上角坐标。
- max(): 返回边界中最大的角点。右下角坐标。
- diagnol(): 返回区域对角线的长度,即边界中最小和最大的角点的距离。
- extend(const MatrixBase<T>& point): 扩展区域的边界,使得该区域包含输入的点。
- translate(): 以a_t为参数进行平移。参数a_t类型须要Eigen::Vector2f。
- sizes(): 返回区域宽度.x()、高度.y()。返回值类型Eigen::Vector2f,因为min、max可能含有小数。